Économie
The Constructed Number: How CPI Systematically Misrepresents Inflation and Why Governments Prefer It That Way
Les essais sont en anglais.
"Show me the incentive, and I'll show you the outcome."
– Charlie Munger.
I. The Predictive Power of Incentives
There is a habit of mind, when confronted with evidence of institutional misbehaviour, to reach for the language of conspiracy. Discussions of inflation measurement are no exception – and awkwardly, those who sense that something is being obscured are not entirely wrong. The error is not in the suspicion that something may not be working correctly. It is in the employed framework.
Conspiracies require coordination, secrecy, and the sustained suppression of dissent. They are fragile, expensive to maintain, and historically prone to collapse under their own unfeasibility and complexity. They are also, for the purposes of this analysis, entirely unnecessary.
Charlie Munger – the late vice chairman of Berkshire Hathaway, and one of the most rigorous analytical minds in modern finance – offered a more parsimonious framework: "Show me the incentive, and I'll show you the outcome." The insight is not cynical, but structural. Individuals and institutions do not need to conspire to produce collectively harmful outcomes. Indeed, they rarely do. They need only to follow their incentives, and the outcomes will arrange themselves accordingly.
This essay is an application of that principle. Its argument is not that governments secretly coordinate to falsify inflation statistics. Its argument is something more precise, more verifiable, and ultimately more troubling: that the incentive structure facing governments, central banks, and the methodological bodies that construct inflation measures is so uniformly aligned toward the understatement of inflation that any other outcome would be the genuine mystery. The methodology did not have to be corrupted by instruction. It only had to be constructed by people responding, as they reliably do, to the incentives surrounding them.
This incentive structure did not emerge fully formed. It has a specific historical origin: the abandonment of the gold standard. Under a gold-convertible monetary system, governments faced a hard external constraint on borrowing – you could not issue more currency than your gold reserves could back, which meant deficit spending and debt accumulation were structurally bounded. The Bretton Woods system, which anchored global currencies to the dollar and the dollar to gold at $35 per ounce, provided a modified version of this discipline until August 1971, when President Nixon unilaterally suspended dollar-gold convertibility – the event now known simply as the Nixon Shock.
What followed was not merely a change in exchange rate regime. It was the removal of the most significant external check on sovereign debt issuance. The constraints that remain – foreign governments selling your bonds, private creditors demanding higher yields, currency markets expressing their verdict through depreciation – are real but defeatable in ways that gold convertibility was not. A government that runs out of gold must stop. A government that runs out of creditors can, for a time, find new ones, print its way through, or simply outlast the market's patience until the old standards become a distant memory and steep indebtedness becomes the new normal. The hard ceiling became a soft one, and soft ceilings, under democratic electoral cycles, have a well-documented tendency to rise.
The incentive to inflate – quietly, persistently, in ways that eroded the real burden of accumulated debt – did not create itself. It was unlocked by the removal of the constraint that had previously made it structurally impossible.
But the Nixon Shock alone does not explain why Western debt-to-GDP ratios have reached their current levels, particularly the acceleration of recent decades. Several structural forces have compounded the original incentive. The most demographically inexorable is population ageing. As the proportion of retirees rises relative to working-age taxpayers, governments face a double fiscal bind: the tax base narrows precisely as the expenditure obligations – pensions, healthcare, long-term care – expand. This is not a cyclical problem that good management can smooth away. It is a structural deterioration baked into the age pyramids of every major Western economy, playing out over decades in slow motion.
Alongside this sits the short-termism endemic to democratic electoral cycles. The politician who cuts spending or raises taxes bears the cost immediately at the ballot box; the politician who borrows passes the cost to a future electorate that cannot yet vote against them. Warren Buffett captured the incentive structure with characteristic economy: "I could end the deficit in five minutes. You just pass a law that says that any time there's a deficit of more than 3% of GDP, all sitting members of Congress are ineligible for re-election." The joke lands because the diagnosis is exact. The deficit is not a technical failure. It is the rational output of an incentive system that rewards borrowing and punishes restraint, applied consistently across administrations of every political persuasion.
A third, more recent, and less discussed factor is the slow erosion of central bank independence. The post-Volcker consensus held that insulating monetary policy from political pressure was the institutional prerequisite for price stability – and for several decades, the data bore this out. But the boundary between fiscal and monetary policy became progressively harder to maintain as debt levels rose and governments found themselves increasingly dependent on central bank asset purchases to absorb sovereign issuance that the private market might not have absorbed at acceptable yields. QE was sold as an emergency measure. It became, in practice, a structural feature of how Western governments fund themselves – and each successive use of it made the next use easier to justify and harder to unwind. The central bank that was designed to discipline government borrowing has, in several significant respects, become its enabler.
The trajectory of this erosion has, at various points in postwar history, seen presidents apply private and occasionally forceful pressure on Fed chairs – Johnson's confrontation with William McChesney Martin in 1965 and Nixon's sustained influence over Arthur Burns in the early 1970s being the most documented precedents. What distinguishes the 2025 episode is not the underlying motivation, which is consistent across administrations that find tight monetary policy politically inconvenient, but the audacity of its public expression and the institutional escalation it reached: sustained public demands for rate cuts, explicit threats of dismissal, and ultimately a Department of Justice subpoena served on the Federal Reserve itself. Previous administrations wanted the same outcome. Few pursued it with the same visibility, and none with the same institutional aggression.
The market's verdict on this dynamic arrived with unusual clarity on 2 April 2025 – Liberation Day. When President Trump announced sweeping tariffs on virtually all trading partners, the dollar did not behave as it has in every previous crisis of comparable magnitude. Historically, the dollar appreciates during periods of global economic stress: investors flee to US assets, and the currency rises as a consequence. This behaviour is not irrational. It reflects the genuine historical reality of the United States as the world's reserve currency issuer, its unparalleled depth of capital markets, and its track record of institutional reliability under pressure. On Liberation Day, the opposite occurred. Every G10 currency appreciated against the dollar simultaneously in the 24 hours following the announcement – a movement that economists describe as contradicting the standard crisis playbook.
The dollar's broader decline through 2025 had multiple causes, of which the tariffs were one. But the specific Liberation Day dynamic is worth isolating precisely because it was not a slow drift driven by accumulated fundamentals. It was an immediate, synchronised judgement by market participants about a specific signal. What they appeared to price in that moment was a question that had not been asked with this degree of urgency for a long time: is the institutional foundation of dollar safe haven status still intact? Not the economic foundation – that remains substantial – but the political and institutional one. The question of whether assets might be safer denominated in euros, Swiss francs, or sterling rather than dollars is not a new question in the abstract. That it was being asked with genuine seriousness, simultaneously, by the most sophisticated capital allocators in the world, in response to a domestic policy decision, is the historically unusual part. The safe haven status of the dollar has not been revoked. But for the first time in a generation, it has been interrogated – and in markets, the asking of a question that was previously unaskable is itself a data point of considerable significance.
What the market appeared to price, for the first time with this degree of consensus, was not merely the tariff shock itself but the broader institutional signal: that the United States could no longer be assumed to maintain the policy credibility and institutional independence that had underpinned the dollar's reserve currency premium. When traders begin to run away from the dollar during a crisis rather than toward it, they are not making a technical call about interest rate differentials. They are making a judgement about institutional reliability – and the direction of that judgement, when it arrives from the most financially consequential participants in the global system, is precisely the kind of market signal this essay has argued deserves to be taken seriously.
The incentive map, once this constraint was removed, assembles itself plainly: governments carry debt whose real burden is eroded by inflation – they benefit from inflation being high. Governments face electoral punishment when inflation is perceived to be high – they benefit from inflation being measured as low. Central banks are evaluated against inflation targets – they benefit from the measure used to assess them trending favourably. The statistical bodies that construct inflation indices receive their funding and their remits from governments – they operate within a framework whose boundaries are set by the institutions that gain most from a particular kind of answer.
None of this requires a directive, a memo, or a meeting. It requires only that, when methodological choices present themselves – choices between geometric and arithmetic means, between fixed and substituted baskets, between hedonic-adjusted and unadjusted prices – the people making those choices work in institutions whose continued credibility, funding, and political support depend on the index remaining within a certain range. Munger's principle does not require bad faith. It operates through entirely ordinary human behaviour, applied systematically, over time.
What follows is an examination of the mechanisms through which that incentive structure has expressed itself. In the construction of CPI itself – through substitution assumptions, path-dependent chain drift, hedonic adjustment, and geometric aggregation – each methodological choice pushes the measured index in the same direction. In the distributional consequences of monetary expansion – through the Cantillon Effect, which ensures newly created money reaches asset owners before it reaches wage earners. In the tax architecture that extracts a further toll on the way out through fiscal drag. And in the price dynamics of the real economy, where inflation locks in permanently through corporate incentive structures and market concentration that has progressively dismantled the competitive mechanism that would otherwise force it to reverse. Individually, each mechanism has a technical defence. Collectively, they form an outcome that is precisely as difficult to see as it is easy to predict: elusive in its parts, inevitable in its whole – exactly what Munger's principle would have forecast before a single calculation was made.
II. Money Talks: The RPI/CPI Divide as Implicit Confession
The most striking evidence that CPI is not a trusted measure of inflation is not found in academic literature. It is found in the gilt market – a corner of the financial system that exists below the threshold of public visibility, and which even within finance is the specialist territory of a subset of fixed income professionals. That this juxtaposition has not become a matter of wider public scrutiny is itself worth noting: a disagreement conducted in basis points between institutional bondholders and a government debt management office does not, by its nature, generate headlines, mobilise voters, or produce political consequence. The evidence is publicly available. The language in which it is written – less so.
The financial sector, which benefits in other ways from the inflationary system this essay discusses – through the Cantillon Effect, through asset price inflation, through its role as the first recipient of newly created liquidity – finds itself, in this particular instance, on the wrong end of the same government's measurement preferences. Even here, the incentive map holds: the government conceded RPI for decades because it had to, and moved to eliminate it the moment it deemed that it could.
When the British government started to issue index-linked gilts – sovereign bonds whose coupons and principal are adjusted for inflation – on 27 March 1981, it did not use CPI, which – back then – did not exist yet. It used the Retail Price Index (RPI) instead, which has historically run approximately 0.9 percentage points higher per year than CPI. The counterparties that demanded this premium were not retail investors or ideological critics of government statistics. They were pension funds, sovereign wealth funds, and institutional asset managers: some of the most financially sophisticated participants in the global capital markets.
They, in aggregate, insisted on being paid more to compensate for a gap they had calculated, priced, and considered material – and they did so not once, but consistently, across decades of renewed contracts. This persistence matters greatly because money has a habit of talking in clearer language than any politician could: these are institutions that lose money when they are wrong, and whose survival depends on being right. Every time a pension fund or sovereign wealth manager has renewed an RPI-linked position rather than accepting CPI, they have placed a financial bet – with their own or their clients’ capital, against their own balance sheet – that the gap between the two measures is real, durable, and goes only one way.
Decades of such behaviour, aggregated across some of the most analytically sophisticated participants in the global capital markets, constitute something close to a market referendum on the question: the reported CPI figure is not an accurate measure of inflation compared to the higher RPI figure. The government, which issued these instruments, conceded to this premium for decades. That concession was an implicit admission: if CPI and RPI were equivalent measures of the same underlying reality, no rational actor would systematically demand RPI – they would simply be surrendering yield for nothing. The fact that the “smart money” insisted otherwise, consistently, at commercial cost, contract after contract, year after year, decade after decade, is perhaps the most market-pure confirmation available in the UK that CPI, as reported, is understood – by those whose financial interests depend on the answer – to understate inflation by a significant margin.
The government's response to this dynamic has been illuminating. In November 2020, the Chancellor of the Exchequer announced that from 2030, index-linked gilts would be forcibly converted from RPI to CPIH, with no compensation offered to existing holders. The projected saving to the Exchequer: approximately £2 billion per year.
What has received rather less deliberation is the logical implication of that figure. If CPI and RPI were equivalent measures of the same underlying reality – as the government insists – the policy would save nothing. One thing we can all be certain of is that no government willingly courts the institutional ill will that comes with unilaterally rewriting the terms of a whole basket of sovereign debt contracts for net savings of precisely zero.
Of course, the saving is not zero at all: it is a projected £2 billion per annum, which is not a fiscal footnote – and its significance sharpens considerably once the precise scope of the instrument is understood. The gap becomes ever more notable once accounting for the fact that the saving does not apply to, or arrive from, the gilt market in its entirety, nor even to all index-linked gilts. It applies only to the specific niche of inflation-indexed instruments issued by the government, and even more specifically the niche within the niche of inflation-indexed government instruments that will not have matured by 2030 – the vintages that survive long enough to be forcibly converted. As of April 2026, that amounts to 29 instruments with a combined nominal value of approximately £361.8 billion. Four index-linked gilts maturing between 2027 and 2030 will have redeemed before the conversion takes effect and contribute nothing to the saving, in addition to all those index-linked gilts that matured since the former Chancellor’s announcement in 2020. The £2 billion flows entirely from the surviving stock running into the 2030s and beyond.
Working backward from the government's own arithmetic, the implied annual gap between RPI and CPIH that justifies a £2 billion saving on £361.8 billion of affected nominal is approximately 0.55 percentage points per year. That figure is, if anything, a floor. The projection was made in November 2020, based on October’s figures, when UK CPIH sat at 0.9% and the reported RPI stood at 1.3%, and when no material inflation surge was anywhere in the consensus forecast. Thus, the timing of the announcement by the government seems hardly coincidental either: it was triggered at a time of a historically low delta of a middling 0.4 percentage points between the CPIH and RPI: the 0.55 percentage point delta derived from the £2bn p.a. saving was modelled on the historical long-run average RPI-CPIH wedge, not on the smaller delta from the October 2020 snapshot, used by the Chancellor to force the decision on investors with less outrage.
In both cases, at the inflation levels that arrived in 2022 and 2023, the annual saving from the conversion would have been substantially larger. The government's implied gap of 0.55pp is the minimum it was willing to acknowledge in its own calculations – and even at that conservative estimate, the gap was considered real enough, persistent enough, and large enough to warrant rewriting the terms of sovereign debt contracts in the face of predictable institutional resistance.
The proof is in the pudding
The Chancellor would have most likely used the November 2020 Technical Bulletin on RPI reform as the internal analytical framework underpinning his decision. Based on that document and the OBR modelling at the time, the 0.55 percentage point delta to RPI suggests the government used a 10-year rolling average RPI-CPIH gap as the basis for its £2bn projection. The 10-year period to November 2020 (roughly 2010–2020) gives approximately:
RPI average ~2.5–2.7%
CPIH average ~1.6–1.8%
For an implied gap of c. 0.8–1.0pp. It is difficult to source where the Chancellor derived his 0.55 projection figure. However, it is worth noting that with a 0.9pp difference between CPIH and RPI, the government’s annual savings from the forcible conversion of the later vintage index-linked gilts would become c. £3.3bn rather than £2bn per annum.
In addition, one needs to consider the implications of a 0.55 percentage point gap: the figures suggest an RPI of 1.45% at a time of 0.9% CPIH. In November 2020, this would suggest a ratio of ~ 1.61x between the investor’s preferred measuring stick of RPI versus the government’s preferred measuring and reporting stick of CPIH. An overly simplistic, yet interesting thought experiment arises from this ratio: if one were to apply this 1.61 ratio to the post-Covid inflationary surge in the UK, what would the past 30 years of UK all-items inflation figures look like?
Naturally, one cannot derive any direct correlations based on a single historical RPI-CPIH gap and extrapolate it blindly over wildly different inflationary regimes.
That a saving of this magnitude can be reverse-engineered from so confined a segment of the market is itself a measure of how wide the structural divergence has become between what inflation is and what the official measure prefers to report – with the direction of the saving confirming, without ambiguity, which way that gap runs.
CPI for the public and RPI for institutional investors has quietly become CPI for everyone. The investors are not happy about it. The government is – and that it would eventually move to capture this saving surprises no student of institutional incentives. Governments do not, as a general rule, leave extractable value on the table: like inflation itself, it operates like a ratchet, slowly but surely churning, always moving one way. This direction of travel is consistent across administrations, across decades, and across jurisdictions.
What makes the 2020 decision remarkable is not its timing against the future heightened risk of bond market vigilantism – that context belongs to what came after. It is its timing against the inflation surge of 2021 to 2023, and the consequent widening of the gap between RPI and CPI, neither of which were anywhere in the consensus forecast at the moment the decision was made. At the point the trigger was pulled, UK CPI sat at approximately 0.9%. The decade preceding it had averaged roughly 2% annually. The prevailing assumption among forecasters, central banks, and market participants alike was that the low-inflation environment of the 2010s was structural, not cyclical – that 2% was not a ceiling being held down but a natural equilibrium.
There was therefore no obvious inflation emergency to prompt urgency, no political cover of a crisis to explain away the decision, and no widely anticipated gap-widening to make the saving look obviously attractive. The gap was considered material enough to address immediately in conditions of near-perfect price calm, on a rolling average backdrop that the methodology's defenders would characterise as broadly accurate. That this government nonetheless concluded – in those conditions, at that moment, against that backdrop – that the saving was worth the friction tells you more plainly than any academic study could how large the structural divergence between RPI and CPI had already become in their own internal reckoning. The inflation that followed in 2022 and 2023 has since made that divergence considerably more visible to everyone else. The UK government, it appears, saw it rather earlier.
III. The Architecture of Understatement
The CPI's systematic bias is not the product of a single methodological choice but of several interlocking ones, each defensible in isolation, collectively devastating in combination. The biases share a common directional property: they all push the measured index downwards. This stubborn consistency of direction seems hardly random.
1. Substitution Bias and the Coercion Fallacy
CPI in its modern form is designed not as a fixed-basket price index, but as an approximation of a Cost-of-Living Index (COLI) – a measure of what it costs to maintain a given level of welfare. Under this framework, when the price of butter doubles and a consumer switches to margarine, CPI interprets this as a welfare-neutral event: the consumer has revealed, through their behaviour, that margarine is an adequate substitute.
This argument rests on a philosophical sleight of hand. The revealed preference framework assumes that behavioural substitution reflects genuine equivalence of satisfaction. But this assumption is only valid when the substitution is made freely. When a consumer switches from butter to margarine because they can no longer afford butter, they have not revealed a preference – they have revealed a constraint. The welfare-neutrality claim collapses.
The formal distinction is between compensated and uncompensated demand responses. A COLI that treats coerced substitution as equivalent to voluntary substitution is not measuring the cost of maintaining welfare. It is measuring something systematically lower – the cost of what people are forced to buy rather than what they would choose to buy.
This error compounds through time. As substitution cycles accumulate – as consumers are repeatedly pushed down the quality gradient, each time registering as a "revealed preference" rather than a welfare loss – the measured index drifts further from the experienced reality. The methodology has no mechanism to distinguish adaptation from satisfaction. Amartya Sen's work on adaptive preferences illuminates this problem at a structural level: people systematically revise their expectations downward when constrained. That revision does not preserve welfare. It describes its erosion.
2. The Path Dependency Problem
The substitution mechanism contains a further structural flaw that has received less attention in public discourse, though statisticians are aware of it under its formal name: chain drift. It arises whenever a price index is constructed by chain-linking successive periods, each of which involves reweighting the basket based on current expenditure patterns. The problem is not that any single reweighting is unreasonable. It is that each reweighting permanently alters the index's sensitivity to future price changes in that category – and as the analysis below demonstrates, the interaction with real-world price behaviour means the drift accumulates systematically rather than cancelling over time.
Consider a consumer basket containing only two items – butter and margarine – each priced at £1 and each carrying equal weight of 50%. Index baseline: 100.
In the first period, butter rises 100% to £2. CPI methodology, applying substitution logic, reduces butter's weight in the basket by halving it, while increasing margarine's weight correspondingly. The recorded inflation for this period is less than 50%: butter's elevated price now contributes less to the index because its weight has been halved.
In the second period, butter holds at £2 while margarine also rises 100% to £2. Both items now cost the same. CPI, detecting that price parity has been restored, reverts toward equal weighting, and the index advances again on the new configuration.
Both items have now doubled from their original prices. A consumer buying equal quantities of both throughout this period has experienced 100% inflation. The question is what the index reports – and the answer depends entirely on which methodology is applied. Running the same two-period scenario under three different methods makes the gap concrete:
Setup – Period 0: Butter £1, margarine £1. Equal 50/50 weights. Index = 100.
Method 1 – Fixed basket, arithmetic mean (what a genuine cost-of-goods index produces):
Period 1: Index = 100 × [(0.5 × 2.0) + (0.5 × 1.0)] = 150
Period 2: Index = 100 × [(0.5 × 2.0) + (0.5 × 2.0)] = 200
Recorded inflation: 100%.
Method 2 – Chain-linked with substitution reweighting, arithmetic mean (path-dependency alone):
Period 1: Butter's weight reduced to 25%, margarine raised to 75%.
Link multiplier = (0.25 × 2.0) + (0.75 × 1.0) = 1.25. Index = 100 × 1.25 = 125.
Period 2: Weights revert to 50/50. Price relatives calculated against Period 1 prices (butter £2, margarine £1):
Butter relative = 1.0; margarine relative = 2.0.
Link multiplier = (0.5 × 1.0) + (0.5 × 2.0) = 1.50. Index = 125 × 1.50 = 187.5.
Recorded inflation: 87.5%. Undercounts by 12.5 percentage points.
Method 3 – Chain-linked with substitution reweighting AND geometric mean (both mechanisms active, as CPI uses in practice):
Period 1: Same reweighting as Method 2: 25% butter, 75% margarine.
Link multiplier = 2.00.25 × 1.00.75 ≈ 1.1892. Index = 100 × 1.1892 ≈ 118.9.
Period 2: Weights revert to 50/50. Butter relative = 1.0, margarine relative = 2.0.
Link multiplier = 1.00.5 × 2.00.5 = √2. Index ≈ 118.9 × √2 ≈ 168.2.
Recorded inflation: 68.2%. Undercounts by 31.8 percentage points.
In summary:
| Method | Final index | Recorded inflation | Undercounting |
|---|---|---|---|
| Fixed basket, arithmetic | 200 | 100% | 0 pp |
| Chain-linked, arithmetic | 187.5 | 87.5% | 12.5 pp |
| Chain-linked, geometric | 168.2 | 68.2% | 31.8 pp |
The gap has not arisen from any single fraudulent calculation. It has arisen because butter's contribution to the index was permanently diminished at precisely the moment its price rose – and when margarine subsequently rose to match it, the index had already repositioned itself around a basket that underweighted the item that first became expensive. The gap between Method 2 and Method 3 – 19.3 percentage points – represents the geometric mean's additional contribution.
This is not a simple addition: the geometric mean's discount in Period 1 reduced the base from which Period 2 compounded. The two mechanisms interact multiplicatively: path-dependency lowers the floor, and the geometric mean then operates beneath that already-lowered floor, lowering it further.
The critical compounding factor behind chain drift is the interaction with downward nominal price rigidity, examined in detail in Section VIII. In a symmetric world – where prices rise and fall with equal ease – chain drift would not be a systematic problem. The understatement that occurs when an expensive item's weight is reduced would be partially recovered when prices later normalise and the corrective reweighting occurs. In the actual economy, that corrective cycle does not arrive. Prices are sticky downward: the item becomes expensive, its weight is permanently reduced, and the conditions that would trigger reweighting in the other direction – sustained price falls – rarely materialise. Chain drift is therefore not random noise that cancels across cycles. It is systematic and cumulative, but its directionality is conditional on the empirical reality of price stickiness. Remove that assumption, and the drift randomises.
The geometric mean aggregation, by contrast, requires no such assumption. By the AM-GM inequality, the geometric mean of any set of unequal positive price relatives is always strictly less than their arithmetic mean, regardless of whether prices are rising or falling. When prices rise, it records less inflation than the arithmetic mean. When prices fall, it records more deflation – pushing the index lower still. In both environments, the geometric mean moves the index downward relative to the arithmetic alternative. The two mechanisms therefore operate on different logical foundations but converge on the same outcome: a measured index that systematically sits below the true cost of the basket, in every price environment, through every market cycle.
Each individual revision is small enough to be dismissed as a technical quibble. Compounded across three decades of annual reweighting, each defensible in isolation, the divergence becomes material. A household that has purchased, does purchase, and will purchase roughly the same categories of essential goods will find that its experienced cost of living diverges from the official index by an amount that grows with every cycle. This is not anecdote. It is the mathematical consequence of path-dependent index construction applied to a world where prices ratchet upwards but never ratchet back.
The categories where this matters most are precisely those where it is least visible and arguably, most consequential: food staples, energy, and housing – categories with low cross-price elasticity in aggregate. You cannot substitute away from eating, heating, or shelter beyond a limited margin, meaning the substitution assumption that drives the weighting shifts is least valid exactly where the path-dependency effect is accumulating the most. Lower-income households in particular, who allocate a higher share of total expenditure to these categories, are therefore most exposed to the drift, and least represented by an index that has been progressively reweighted away from essential goods they cannot stop buying.
This is not what measurement error looks like. Measurement error is stochastic by nature – randomly distributed, sometimes high, sometimes low, with no persistent directional tendency. Given sufficient cycles, the law of large numbers pulls the aggregate estimate back toward the approximate truth. What chain drift produces is categorically different: a structured, non-reversing, compounding departure from that approximate truth, in a single direction, across every revision cycle, for as long as the methodology is applied. The butter never returns to its original weight in the index. The ratchet does not turn back.
3. Hedonic Adjustment and the Spirit of Time
A third class of downwards adjustment operates through the concept of hedonic regression – the attempt to isolate "pure" price changes from quality improvements. When a laptop manufacturer increases processing speed by 50% while holding price constant, CPI methodology records this as an effective price decrease of roughly equivalent magnitude. The logic is that the consumer is receiving more value for the same money, and the index should credit this improvement.
The error here is one of temporal reference. The assumption is that technological progress should be measured against a static baseline – that an iPhone 15 is objectively more valuable than an iPhone 14, significantly more valuable than an iPhone 7, and that this surplus value should be credited to the index's quality adjustment. But this framing ignores the only benchmark that is economically meaningful to the consumer: what represented the technological frontier at the time of purchase.
In 2016, an iPhone 7 owner was purchasing the most capable consumer device available, allocating roughly the same proportion of disposable income that an iPhone 15 owner allocates today. The relative sacrifice – what the consumer gives up against their total resources to occupy the same relative position in the technological hierarchy of their time – has remained stable. The absolute technological distance between 2016 and 2026 cannot be attributed as a saving, because the minimum viable position for full participation in modern economic life moves with the frontier, not against a fixed capability baseline.
Crucially, that old position is not merely superseded – it is revoked. An iPhone 7 purchased today would power on; it would make calls. It would not receive security patches, cannot run a growing catalogue of applications that require iOS 16 or later, and is locked out of features now considered baseline – not premium – smartphone functionality. The consumer did not choose to upgrade. The upgrade was imposed on them. Hedonic adjustment, by treating that enforced progression as an in-pocket financial gain, systematically credits price stability that does not exist in the consumer's experienced budget.
A second distortion compounds the first. Durability and repairability have declined alongside performance improvements – and these are not separate phenomena but opposite faces of the same product evolution. Hedonic adjustment credits the improvement. It does not debit the deterioration. The asymmetry is not incidental: it is structural, and it runs in one direction only – the one that suppresses the measured CPI index. The consumer pays more, more frequently, for hardware engineered with shorter replacement cycles, and the methodology records none of that structural cost. The distortion therefore operates on two distinct axes: one discounting price increases through the imputed gains of technological progress, the other ignoring the cost implications of technological regression – shorter lifespans, reduced repairability, enforced obsolescence.
The ledger is out of balance. The credit is taken. The debit is never entered. The net effect is a methodology that systematically records goods as cheaper than consumers experience them to be. Substitution bias operates through a different mechanism – replacing dearer choices with cheaper ones in the basket before the price increase is ever fully counted – but the directional effect is identical. Together, they do not merely introduce error. They introduce error with a consistent sign.
The full implications of the error in hedonic adjustment become visible when the methodology is stress-tested against a longer, almost nonsensical, temporal frame rarely used in measurement: consider the development of housing and housing prices, but expand your regime from the usual few years or decades to several centuries.
A wealthy Roman citizen of two thousand years ago occupied, by the standards of his era, the equivalent of what the finest properties in contemporary London or New York represent today – maximum space, premium location, finest available materials, the apex of contemporaneous construction. That dwelling had no running water beyond what servants carried, no electrical infrastructure, no central heating, no insulation to modern standards, no fire safety systems. Under the hedonic adjustment framework applied consistently, every one of these features present in a modern moderate-income flat but absent from the Roman villa represents a quality improvement that must be credited against the price of housing. Applied with its own logic, the methodology would conclude that housing has become dramatically cheaper in quality-adjusted terms over two millennia: the modern tenant in a mid-market flat is receiving so vast a surplus of quality over the historical baseline that any nominal price increase should be largely absorbed by quality credits.
The conclusion is self-evidently absurd when measured against the notion of the spirit of time. Its absurdity is also the point. The error is not that running water fails to represent a genuine improvement in human welfare – it plainly does. The error is more fundamental to the measurement: the comparison is categorically invalid before any calculation begins.
The Roman aristocrat occupied the apex of everything their era made available. They possessed, almost by definition, every amenity that could be possessed, certainly purchased. They had the wealth, the status, and the connections to acquire – for all intents and purposes – whatever existed. If running water had existed and been acquirable, they would have had it. Thus, its absence from the ancient villa may constitute a quality deficit compared to modern standards, but it is not a quality deficit relative to the historical standard. Rather, it reflects the constraints of the time and what technology was available. You cannot credit a modern dwelling for possessing a feature that a historical dwelling lacked when that feature did not yet exist in the world. The historical dwelling was not inferior to the possible – it was the possible.
A clarification on method is warranted here, because the choice of two millennia is not merely rhetorical excess, but a tool that exposes the accumulation of underlying methodological biases under extended regimes that may otherwise go unnoticed. This is because hedonic adjustment in practice is calibrated over short time horizons: months between model revisions, annual basket updates, occasionally a decade of retrospective analysis. At these scales, the methodology's errors are containable, its assumptions superficially plausible, its distortions invisible beneath the noise of normal price variance.
The Roman villa example is a deliberate reductio ad absurdum: it takes the methodology's own logic and applies it over a time horizon that the theory has never been asked to survive. And that is the point: not that CPI is ever applied across two thousand years in practice, but precisely that it never is. The framework is calibrated exclusively at short range, where its assumptions feel intuitive and its distortions remain below the threshold of visibility. The long view is never taken, and because it is never taken, the absurdity is never noticed. Extending the logic to a longer time frame strips away the core defence that the methodology relies on for plausibility. The "quality improvements justify price credits" argument sounds reasonable when comparing a 2022 laptop to a 2021 laptop. It collapses entirely when the same logic produces the conclusion that a modest modern flat represents a vast welfare surplus over the finest dwelling a Roman aristocrat could acquire, given the differences in available technology. If the framework produces absurdity at one end of the temporal scale, the question it cannot answer is: at what point, exactly, does it stop producing absurdity and start approximating truth? The methodology offers no principled answer, because the error is not one of degree – it is one of kind.
What follows from this is a principle the essay now makes explicit: any comparison across historical periods must evaluate each era against its own frontier of the achievable, not against a frontier that had not yet been reached. The principle is not a mere historical curiosity either, but runs in both directions. Consider a flat half the size of a modern moderate home, only this time, built two thousand years from now rather than in the past – a world where ambient air-cleaning technology has rendered manual cleaning obsolete, where materials self-repair, and where energy costs approach zero. Under the hedonic framework's own logic, that smaller future dwelling would be credited as dramatically more valuable than a spacious home today – and any nominal increase in its price would be largely absorbed by quality adjustments reflecting technologies that do not yet exist. The conclusion against a framework agnostic to the rising tide of technology over time is flawless. The conclusion against a framework integrating the temporal scope: absurd. Yet it is the conclusion the framework produces whether run forward or in reverse. The Roman villa example is only special insofar as it is applied in the only direction of time we are able to observe.
The hedonic framework, by treating the sum of all subsequent technological development as a quality gain that should reduce the measured price of modern housing, is not altruistically adjusting for quality. Rather, it is treating the entire march of civilisation as a discount coupon. The methodology has no mechanism to correct for the only comparison that is epistemically valid: the relative position of each consumer within the distribution of what was actually available to them, in their own time.
That comparison, made correctly, would show the Roman aristocrat at the apex of their era's distribution, the modern moderate flat dweller somewhere in the middle of theirs, and the future inhabitant of that technologically saturated, but smaller dwelling, somewhere below the moderate modern flat dweller. In each case, the hedonic framework would credit a windfall that no inhabitant actually experienced – the Roman did not begrudge the lack of electricity even as you may now, after this section, begrudge the lack of a self-cleaning household. As a result of this adjustment, in both cases, the credit runs in the wrong direction.
The mechanism also generalises beyond housing. Every time a standard that was once exceptional becomes mandatory, hedonic adjustment credits the consumer as though they have received a financial windfall. Yet every time the floor of acceptable existence rises, it also drags costs with it. The improvement is often real. Running water is genuinely better than its absence; no serious argument suggests otherwise. But the credit is still illegitimate, for a reason that has nothing to do with whether the improvement is welcome: the historical baseline against which the comparison is made could not have possessed that feature, because it did not yet exist.
You cannot reduce the measured cost of today's housing by crediting it for technologies that were unavailable in Rome, any more than you could reduce the measured cost of a Roman villa by crediting it for failing to include a medieval fireplace. A modern shoe may be ergonomically superior to an ancient boot, and the methodology would credit that advance as a quality gain and adjust the price downwards accordingly. It would not debit the decline in sole longevity, the reduced repairability, or the shorter replacement cycle that modern production has introduced in its place. The ledger, as established, runs in one direction only. Yet the methodology insists, across millennia if asked, that the book balances.
4. The Geometric Mean: Substitution Baked In Twice
One of the least-discussed but mathematically most fundamental sources of downwards bias in the CPI index construction methodology is the use of geometric rather than arithmetic means in aggregating price changes at the elementary level. CPI calculates the average of individual price relatives using the geometric mean; RPI uses the arithmetic mean. Through the AM-GM inequality, the geometric mean is always less than or equal to the arithmetic mean, with equality only when all values are identical. In practice, price changes are never identical. Accordingly, the geometric mean will always produce a lower reading than the arithmetic mean given any real-world variance – and the greater the dispersion of price changes, the larger that gap will be.
While the concept of the geometric mean was already explored in the section covering path dependency, a recap with a direct illustration is warranted to make the scale of potential bias introduction explicit. If bread and milk both cost £1 each, and bread rises by 100% while milk falls by 50%, the arithmetic mean records 25% inflation. The geometric mean records precisely zero – despite the fact that your actual spending on both items at original quantities has increased by 25%. The number in the headline is 0%. The number in your wallet is -25%.
The defence of geometric aggregation is that it implicitly incorporates substitution behaviour: consumers shift toward goods rising least in price, so the geometric mean more accurately captures their actual expenditure pattern. This argument is coherent but often damning in context. It means the substitution assumption is embedded not merely in the basket reweighting methodology, but in the mathematical formula used to aggregate the basket itself.
In practice, this means the same consumer is assumed to substitute twice: once when the basket is reweighted towards cheaper goods, and again when the geometric mean is applied to aggregate prices within that already-adjusted basket. The justification used is the same both times. The downwards pressure on the index, however, gets applied twice, at two separate layers of the methodology, without the doubling being visible in any single step. To a layperson reading the headline inflation figure, there is no trace of this. The number appears to be a measurement. Yet it is, in part, an assumption – applied twice over, at two separate levels of the calculation, each individually defensible, but together systematically compressive.
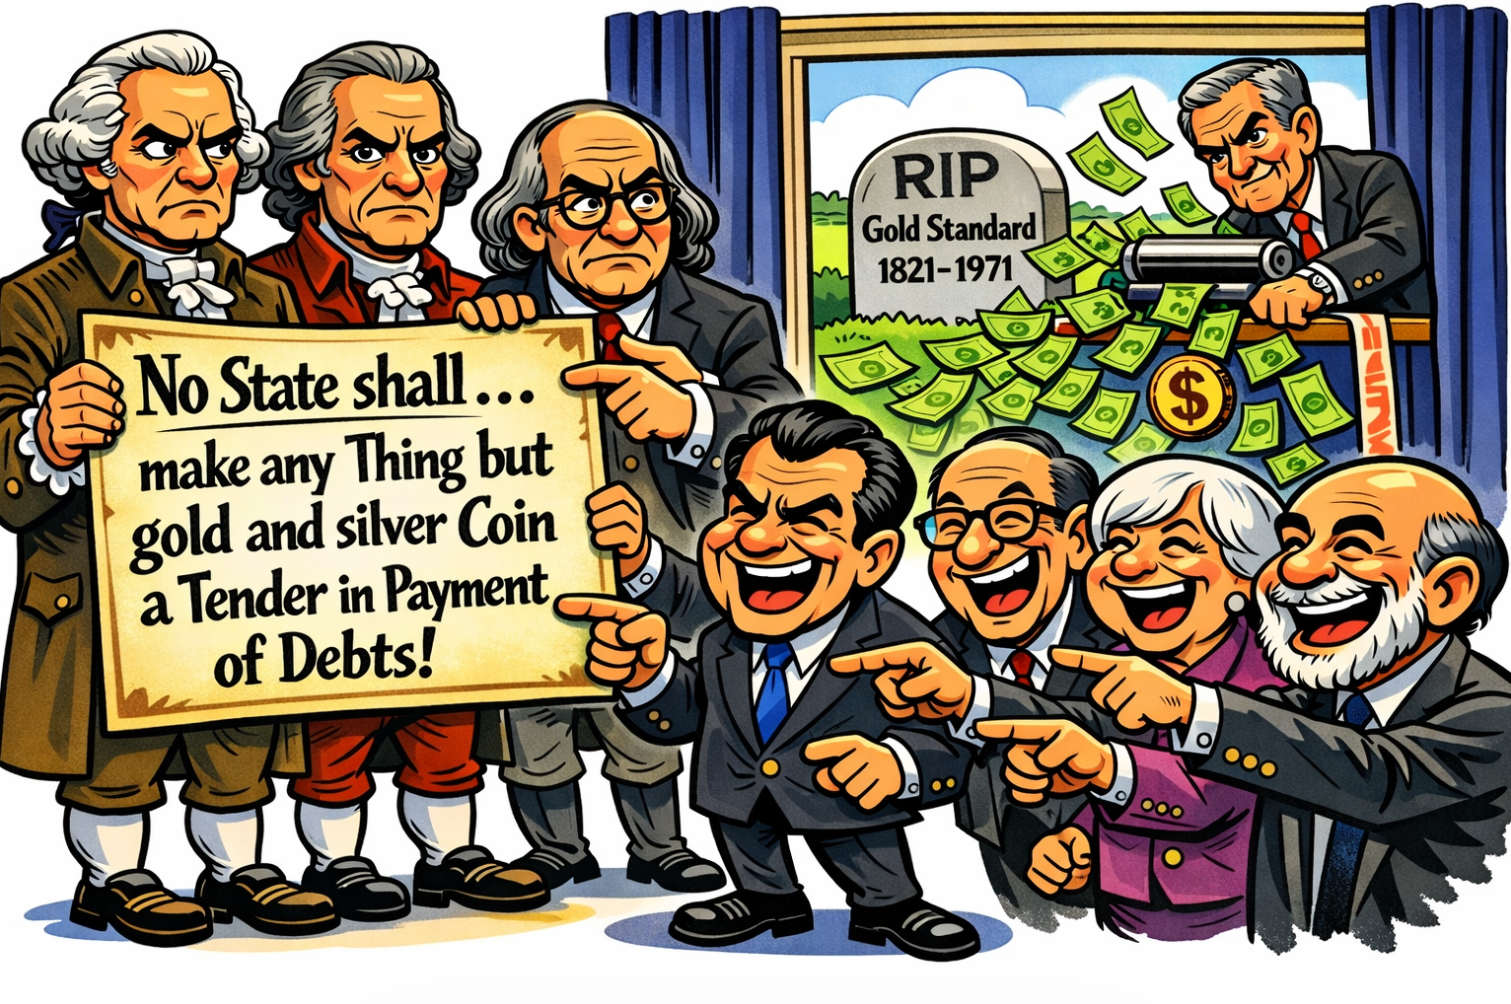
IV. In Memory of the Gold Standard
It is worth pausing on what the gold standard actually prevented – not merely inflation, but the financing of catastrophe at the expense of those who did not consent to it. In 1914, a prolonged European war was, under a functioning gold standard, fiscally inconceivable. The gold constraint was not a technicality; it was a hard limit on how much a government could spend beyond its means. A war of the scale that materialised would have required taxation so immediate and so visible that no population would have sustained it. The gold standard, in this sense, was not merely a monetary arrangement. It was an accidental democratic safeguard.
The suspension of gold convertibility at the outbreak of the First World War – enabling the creation of money unbacked by any real asset – did not conjure additional shells, rifles, or men. It conjured the means to pay for them through a mechanism the population could not easily see or vote against. The tax was levied. It was simply not presented as one. It was distributed instead through the silent dilution of every unit of currency held by every citizen – the inflation tax, falling heaviest on those least equipped to avoid it. Ludwig von Mises was precise on this point: to finance war through monetary expansion rather than direct taxation was, in his formulation, “essentially antidemocratic”. The consent of the governed was not sought. It was bypassed.
It is also worth noting what happened to central banks during this period. At the outbreak of war, the central banks of every belligerent power became subordinate to the fiscal requirements of their respective governments – the independence that had provided a partial brake on monetary expansion was suspended, quietly and without ceremony, for the duration.
After the 1918 armistice, the major powers attempted to restore the gold standard, but the attempt foundered on an uncomfortable arithmetic reality: their currencies had been inflated so substantially during the war that a genuine return to pre-war gold ratios was politically and economically painful. Most quietly abandoned the attempt. The United States did not. In a unilateral effort to restore the pre-war dollar-gold parity – following the lifting of the gold export embargo in 1919 – the Federal Reserve contracted credit at rates not previously seen, producing the severe depression of 1920 to 1921. The deflationary shock radiated outward. The economic dislocations it contributed to across Europe did not remain economic for long.
Stated with deliberate bluntness: the abandonment of the gold standard, and the consequent removal of democratic accountability from the money supply, created the fiscal conditions that made the First World War possible. The inflation it generated, and the deflationary attempt to reverse it, then produced the economic calamity that swept across Europe – and in Germany specifically, destroyed the savings of the middle class, eliminated the social stability that might have resisted political extremism, and provided the precise conditions of desperation and resentment that a demagogue required.
In other words: the abandonment of the gold standard enabled the First World War; its aftermath created the conditions for the Second. This is a simplification, yet not a distortion.
You will not read that in any modern textbook.
V. The Cantillon Effect: Inflation as Wealth Transfer
The previous sections have examined how headline inflation gets systematically underreported through a combination of different channels operating in concert, each defensible in isolation, less so in conjunction, all operating in the same direction. This section expands the analysis to the societal consequences, introducing the question of who bears the cost of the inflation that does occur, and subsequently who gets to collect the benefit. The answer is not symmetrical, and the asymmetry is not incidental.
When a central bank injects liquidity into the financial system – whether through quantitative easing, emergency repo operations, or direct asset purchases – that money is not dispersed simultaneously, let alone equally, in every corner of the economy. It arrives first where the plumbing connects: at the major commercial banks, primary dealers, and institutional asset managers who are the counterparties to central bank operations. These institutions receive the new money at the moment of creation, before any corresponding adjustment in asset prices, consumer prices, or wages has occurred.
This sequential property of money creation is the Cantillon Effect, first described by Richard Cantillon in his Essai sur la Nature du Commerce en Général in the 1730s, and largely absent from mainstream macroeconomic teaching despite never having been refuted. Its distributional implication, however, is stark and politically inconvenient: the earliest recipients of newly created money invest it into an economy where prices have not yet adjusted. They purchase equities, real estate, commodities, and financial instruments at prices that reflect the money supply prior to its expansion. By the time that liquidity has travelled through the financial system, been intermediated through credit markets, and eventually translated into wage increases for ordinary workers, the asset prices have already repriced to reflect the expanded money supply. The window of purchasing power advantage has closed – for everyone except those who were standing at the spigot when it opened.
The practical illustration from the post-2008 and post-2020 QE cycles is not hypothetical. Between 2009 and 2021, the S&P 500 rose by approximately 700%. UK house prices roughly doubled over a comparable period. During the same interval, median real wages in both the UK and US were essentially flat, recovering only modestly from post-crisis troughs before being eroded again by the 2021–23 inflation surge. The mechanism is precise: QE inflated asset values; asset ownership is concentrated among the wealthiest households; wage growth lagged asset price growth by years and never closed the gap. The monetary expansion did not lift all vessels equally. It raised yachts to heights never previously reached. Smaller craft were lifted modestly, belatedly, or not at all. Some were swept underwater.
This is not a flaw in the execution of monetary policy. It is a structural property of how modern monetary transmission works. Any system in which new money enters through financial intermediaries rather than directly into household incomes will redistribute purchasing power from late recipients to early ones. In practice, late recipients are wage earners and fixed-income savers. Early recipients are financial institutions and their principal clients.
The consequences extend beyond income. When asset prices inflate faster than wages for long enough, the entry price to asset ownership – property, equity, capital – rises beyond the reach of those who do not already hold it. Social mobility does not merely slow; it is structurally foreclosed, the ladder pulled away from those still queuing at the base. The promise that diligence and credentials translate into prosperity – that studying hard, working hard, and playing by the rules of the game will yield a proportionate share of it – becomes increasingly hollow, not because individuals have failed the system, but because the system has been structurally tilted against the late entrant. The game is not merely difficult. For many, it was rigged before they sat down.
This is the Cantillon effect – identified in the eighteenth century, unrefuted since, and almost entirely absent from formal mainstream policy discourse, despite its explanatory power over the very outcomes that policy produced. The reluctance towards naming it is fundamentally no different to why the CPI index is constructed as it is: the answer, when stated plainly, is politically intolerable.
Here, we will state it plainly:
Monetary expansion transfers purchasing power from those who hold it in cash or fixed income – wages, savings, pensions, benefits – to those who are deeply indebted in nominal terms and whose revenues expand with rising prices. Equity holders and property owners are partially shielded. Those with neither are not shielded at all: the unemployed, the disabled, and those dependent on fixed state support bear the brunt of the inflationary cost.
To make the government's structural incentive concrete rather than abstract, it is worth applying the most neutral available financial framework to its own balance sheet – not the headline debt-to-GDP figure it prefers to cite, but the Whole of Government Accounts, compiled under IFRS: the same accounting standards it mandates for every listed company in the private sector, now turned on the institution that mandates them. Not so fun, it turns out.
The results, as of 31 March 2024, are as follows:
Total assets of £2.65 trillion.
Total liabilities of £5.02 trillion – nearly double.
Net equity of negative £2.37 trillion – charming.
The WGA liability-to-GDP ratio is approximately 186%, against the headline figure of roughly 93% typically reported: the difference accounted for almost entirely by £1.3 trillion in unfunded public sector pension obligations and broader financial liabilities excluded from the National Accounts definition of debt.
Were the UK government a listed company, its auditors would have qualified its accounts on going concern grounds before the ink dried – as it happens, the government controls both the ink and the paper it is written on. Its debt-to-equity ratio would be undefined, the negative equity rendering the calculation meaningless. Its board would face immediate questions about solvency – or, in several jurisdictions, criminal liability for trading whilst insolvent.
The corporate analogy is deeply imperfect. The government cannot go bust in the conventional sense: it can levy taxes, issue gilts in its own currency, and influence the rate at which its nominal liabilities are eroded. But the balance sheet is real, and what it reveals is this: the entity most structurally incentivised by inflation is the one carrying £2.37 trillion in negative equity, whose tax revenues compound upwards through fiscal drag as prices rise, and whose fixed nominal liabilities shrink in real terms with every percentage point of inflation, measured or unmeasured.
One might almost conclude that persistent monetary expansion had been designed to service the government's deepening fiscal deficits and arrest its spiralling debt-to-GDP ratio – rather than doing so, as is customarily maintained, as an entirely unintended consequence of emergency monetary intervention.
Who could have known.
Contrary to common rhetoric, the primary and most structurally complete beneficiary of this arrangement is neither a bank, nor a billionaire, even as both indirectly benefit from the structure. It is the government itself: the single entity that is grotesquely indebted in nominal terms, whose tax revenues inflate with the price level (more rapidly still, through the addition of fiscal drag), which controls the rate of monetary expansion, and which also controls the methodology by which that expansion's consequences are measured and reported. It first benefits from the inflation. It then benefits from the subsequent undercounting of that inflation. It controls both instruments that produce each outcome.
This is not a cheap criticism of government as an institution. The state performs functions that are essential, and the appropriate scope of its role in various domains is a legitimate and separate debate. The criticism here is far narrower and, in some ways, more troubling: that the measuring instrument used to report the consequences of fiscal and monetary decisions systematically understates those consequences – and while this understatement serves the interests of the entity that controls both the instrument and the decisions in the short term, it does not even achieve that in the long term.
Most inside government do not understand the true inflationary cost of persistent monetary expansion. The constructed number conceals it from them as effectively as it conceals it from everyone else – the spider caught in its own web. In that sense, inaccurate measurement is ultimately a losing proposition for everyone involved. It masks the real cost of reckless policy from the electorate that bears it, from the institutions that enact it, and from the democratic process that might otherwise correct it. If the true figure were visible – reported honestly, understood clearly – perhaps the conversation would change. Perhaps voters, given a fuller picture, would recognise that the fiscal deficits accumulated over recent decades, and the mounting debt-to-GDP ratios they have produced, are not sustainable. That something must eventually change. A methodology that chronically underreports will produce policy that chronically under-corrects.
What this implicates, in the final analysis, goes beyond measurement methodology. The direction of these distortions – consistent, compounding, and uniform – is not incidental. Structural choices were made, by identifiable institutions, across identifiable decades, with identifiable beneficiaries. A political system that permitted, and in many cases actively ratified, those choices is not a passive backdrop to this story. It is part of the story. That analysis belongs elsewhere. But the numbers, read honestly, point towards it.
VI. Fiscal Drag: Taxing the Illusion of Prosperity
The Cantillon Effect operates on the asset side of private and public balance sheets. Fiscal drag operates on the income side, and the two mechanisms together form a complete circuit of regressive redistribution. By now, you might be able to guess the sole beneficiary.
Fiscal drag occurs when nominal wages rise with inflation but income tax thresholds remain static or are uprated below the inflation rate. The worker whose salary increases by 8% in a year of 8% inflation has experienced zero real wage growth (in reality, under such circumstances, the worker would have experienced a reduction in real salary because of the underreporting of the CPI measurement).
But if that 8% nominal increase has pushed them across a tax threshold, they now pay a higher marginal rate on the incremental income. Their real post-tax position has deteriorated, not improved, despite their salary number rising. They are poorer while being taxed as though they are richer.
In the UK, the Conservative government “froze” income tax thresholds from 2022 through to the 2028 horizon established in their final Budgets – a period spanning the sharpest inflation surge in four decades. The OBR estimated this would drag approximately 3.2 million additional taxpayers into the basic rate band and over 400,000 into the higher rate band by the mid-2020s.
The voters were outraged over this treachery. The Conservatives had, after all, explicitly pledged – as a manifesto commitment – not to raise income tax. From the Conservatives’ perspective, nothing of the sort had occurred. It was a fiscal freeze, not a tax rise.
It was a tax rise.
The Labour government, upon taking office in 2024, did not reverse the freeze. It extended it – to the 2030–31 horizon established in its first Budget, inflation still running above target even by official measures. The OBR estimated that the combined effect of both freezes would drag 6.1 million additional people into income tax altogether, and 4.8 million additional workers into the higher rate band, by 2030–31.
The voters were outraged over this treachery. Labour had, after all, explicitly pledged – as a manifesto commitment – not to raise income tax, or most other taxes. From Labour’s perspective, nothing of the sort had occurred. It was a fiscal freeze, not a tax rise.
It was a tax rise.
George Carlin spent a career cataloguing a similar manoeuvre. Shell shock became battle fatigue, became operational exhaustion, became post-traumatic stress disorder. Toilet paper became bathroom tissue. False teeth became dental appliances. The dump became the landfill, car crashes became automobile accidents, and the UK’s particular favourite: partly cloudy became partly sunny. The words grew in length, but the underlying reality remained unchanged.
Fiscal drag follows a similar pattern, with one crucial distinction. Unlike Carlin's examples, the obfuscation here is not achieved through length alone, but through register: a dry technical term borrowed from economics that arrives laundered through mud, carrying the stench of structural inevitability rather than announcing itself for what it is – a decision to collect more income tax. Most will not register it as a tax rise. That, of course, is the intention.
The mechanism compounds the Cantillon Effect cleanly. The asset-owning class is partially shielded, experiencing inflation primarily as capital gains – wealth that, in many jurisdictions, is either taxed at preferential rates, deferred until realisation, or structurally sheltered through vehicles unavailable to wage earners.
The wage-earning class experiences inflation as nominal income growth that is then taxed at ordinary rates, often at higher marginal rates than before the inflation occurred – fiscal drag doing its quiet work. The same inflation event that transfers purchasing power toward asset holders on the way in retrieves additional purchasing power from wage earners on the way out, via the tax system.
But the primary beneficiary of both movements is neither the asset holder nor the bank. It is something else altogether – a bankrupt entity by corporate standards that collects the additional tax revenue, squeezes the margin through fiscal drag, services its nominal liabilities in debased currency, and reports the magnitude of the process through a methodology it also controls. The inflation gives. The tax takes. The measurement obscures. And the same institution sits at the centre of all three.
Wonder what it could be.
VII. Real Wages and the Gap That Cannot Be Papered Over
The final compounding layer is the relationship between nominal wage growth and actual inflation – not CPI as reported, but inflation as experienced.
Even accepting the official CPI figures for the 2021–23 inflation surge – which peaked at 11.1% in the UK in October 2022 – median wage growth consistently lagged behind, producing the largest sustained fall in real wages since records began. On the government's own numbers, workers were poorer at the end of this period than at the start. If the arguments advanced in earlier sections of this essay are correct, and CPI systematically understates experienced inflation, then the real wage losses were larger still than the official figures acknowledge.
The mechanism matters here. The items most poorly captured by CPI's hedonic adjustments and substitution assumptions are precisely those that dominate lower- and middle-income household budgets: food, energy, rent, and transport. These categories experience less technological improvement (and therefore receive fewer hedonic credits), exhibit lower cross-price elasticity between substitutes (meaning the substitution assumption holds least well exactly where consumers are most price-constrained), and represent a higher share of total expenditure for lower-income households than for higher-income ones. The result is that CPI's systematic downward biases are most acute precisely for the households for whom accurate inflation measurement matters most, and least acute for those who are insulated from it by asset wealth.
This is not merely a statistical observation. It has concrete implications for collective bargaining, welfare uprating, pension indexation, and any wage negotiation that uses CPI as its reference. Each of those negotiations is conducted on terrain tilted by a measurement that systematically disadvantages the party with least leverage.
VIII. The Ratchet: Why Inflation Locks In and Never Reverses
The monetary and fiscal mechanisms described in earlier sections explain how inflation is generated and by whom its costs are disproportionately borne. They do not fully explain one of the most empirically consistent features of inflation in modern economies: it is nearly irreversible at the level of individual prices. Prices rise in response to supply shocks, cost increases, and monetary expansion. They do not fall when those pressures recede. The ratchet turns in one direction only.
This is not a market failure in the conventional sense. It is, again, the predicted outcome of the incentive structure.
1. Downward Nominal Rigidity: The Formal Mechanism
The asymmetry of price adjustment has been documented empirically across multiple decades and jurisdictions. The Bank of England's foundational research on price stickiness identified a consistent pattern: firms respond rapidly to rivals' price cuts – competitive pressure demands it – but respond slowly, if at all, to reductions in their own input costs. The decision to raise prices and the decision to lower them are not symmetric operations. Raising prices requires a justification legible to consumers. Lowering prices, in a firm's internal calculus, is a permanent concession of margin that is nearly impossible to reverse once granted. The mathematics of equity valuation enforces this: a firm that voluntarily compresses its margin without competitive necessity will be punished by its shareholders. No executive can justify to a quarterly earnings call that they reduced prices because the oil price fell, when they could instead have reported record margins.
The result is that cost increases pass through to consumer prices rapidly and completely, while cost decreases are absorbed as margin improvement and pass through to consumer prices barely or not at all. This is not corporate malfeasance. It is corporate rationality, operating precisely as its incentive structure dictates.
2. The Media as Coordination Infrastructure
There is a mechanism less examined in the academic literature that deserves explicit naming. When a supply shock occurs – whether an oil disruption, a pandemic, or a geopolitical event – the media response is immediate, extensive, and directionally uniform: prices are going up. This coverage is not wrong. It correctly reports what analysts expect. But it performs a secondary function that is rarely acknowledged: it provides common knowledge to every firm in every affected sector simultaneously.
When every firm reads the same forecasts of 9% food price inflation, each firm knows that every other firm has also read those forecasts. Each firm now expects its competitors to raise prices. Each firm therefore has a rational basis to raise its own prices in anticipation of cost increases that may not yet have materialised, and beyond the cost increases that do materialise – because the shared expectation has created a coordination point. No phone call is required. No cartel meeting occurs. The public information infrastructure of financial media has done the coordination work for free, invisibly, and in a manner entirely immune to competition law.
This is a Schelling focal point applied to corporate pricing. The media-amplified inflation narrative functions not merely as information but as a permission structure – a publicly legible justification that consumers have already been prepared, through weeks of coverage, to accept. As one strand of evidence: executives were documented in earnings calls during 2021–23 explicitly telling shareholders they were maintaining elevated prices even as input costs declined, because consumer expectations had been set by the broader inflation environment. The permission, once granted by the narrative, does not expire when the underlying cause does.
When the supply shock recedes, the inverse coordination problem does not arise. There is no comparable media infrastructure broadcasting that prices should now fall. A retailer who cuts prices gains no legibility benefit – there is no shared consumer expectation of deflation against which to position. And the competitive dynamic that might force price reductions – a rival undercutting to gain share – is suppressed in concentrated markets where the cost of a price war to all parties exceeds the benefit to any single firm of initiating one.
3. Greedflation: The Empirical Record
The 2021–23 inflation surge provides the most thoroughly documented case study of this mechanism in modern economic history. Analysis by the Economic Policy Institute found that corporate profits explained over 40% of the rise in the US price level between end-2019 and mid-2022, against a historical norm of 11–12% over the preceding four decades. A separate analysis found profits drove 53% of inflation specifically in mid-2023 – at a point when energy costs had already begun to normalise. Profit margins, in other words, did not merely hold steady during the inflationary period. They expanded.
The counterargument from classical economists – that rising profits during periods of constrained supply are exactly what supply and demand theory predicts – is technically correct but insufficient. Supply and demand theory also predicts that margins compress when supply normalises and competition returns. The empirical record shows margins remaining elevated well beyond the supply shock period. Something other than the standard model is required to explain that persistence, and the mechanisms described above – downward nominal rigidity, media-coordinated pricing expectations, and reduced competitive pressure from concentrated markets – provide it.
4. Market Concentration as Amplifier
The relationship between market concentration and price stickiness is not linear – it is multiplicative. Research from the Bank of Canada modelling oligopolistic markets found that the joint effect of pricing power and nominal price rigidity more than doubles the propagation of cost shocks into sustained price increases, compared to what competitive market models would predict. In concentrated markets, firms have both the ability to sustain elevated prices (reduced competitive pressure to undercut) and the incentive to do so (the margin extraction is simply larger when there are fewer rivals to challenge it).
This concentration has increased systematically across Western economies over the past three decades. In UK grocery retail, four supermarket chains control approximately 65% of the market. In digital advertising, two firms – Alphabet and Meta – control over 60% of global spend, a position so dominant that businesses have no viable alternative and price sensitivity is structurally suppressed. In cloud computing, three providers control over 65% of global infrastructure, with switching costs so high that the market has features closer to a utility monopoly than a competitive technology sector.
The template is consistent. A well-capitalised entrant – often backed by patient capital that tolerates sustained losses – prices aggressively below cost, compressing or eliminating incumbent competitors. Once market consolidation is achieved, the economics reverse: pricing power is exercised, margins expand, and the consumer who benefited from the predatory pricing phase finds that the competitive structure that would have disciplined those margins no longer exists. The taxi and ride-hailing market is one example. The more consequential examples are digital platforms, where the elimination of local advertising markets, local news economics, and independent retail has transferred pricing power upward to a small number of firms whose market positions are now effectively unassailable through organic competition.
The macroeconomic consequence is that the inflation ratchet, already structural at the level of individual firm behaviour, is amplified at the sector level by concentration that removes the competitive mechanism that would otherwise force price normalisation. Each inflation shock becomes an opportunity not merely to pass through costs, but to consolidate margin gains that concentration then permanently protects. The ratchet does not merely turn – in concentrated markets, its teeth are deeper, and the mechanism that should allow it to reverse has been progressively removed.
When this is viewed through Munger's lens, no further explanation is required. The firm is incentivised to raise prices when costs rise. It is incentivised to raise prices when its competitors are expected to, regardless of its own costs. It is never incentivised to lower prices unless forced by competition. And the competition that would force it has, in sector after sector, been eliminated, acquired, or regulated into irrelevance.
Show me the incentive. Here is the outcome.
IX. The Complete Circuit
Return, at the end, to where the analysis began.
Charlie Munger's principle does not promise fraud. It does not require it. It predicts something quieter and more durable: that institutions, left to construct the instruments by which they are measured and judged, will – through entirely ordinary incentives, applied consistently, across decades – produce instruments that measure them favourably. The question this essay set out to answer was not whether that has happened, but through how many independent mechanisms simultaneously.
The circuit, now fully traced, has six interlocking stages, and more are bound to exist beyond its perimeter.
Governments pursue expansionary fiscal and monetary policy because the incentives to do so – debt erosion, electoral popularity of public spending, avoidance of short-term pain – are structurally overwhelming within short democratic electoral cycles. The money created by this expansion enters the financial system unevenly, transferring purchasing power to asset owners before price adjustment closes the window – the Cantillon Effect, operating not by design but by the arithmetic of how liquidity enters the system. The inflation that results is then measured by instruments that, through substitution adjustments, geometric aggregation, hedonic regression, and the exclusion of key cost categories, report a figure systematically below what is actually experienced. The nominal wage growth that eventually reaches ordinary workers is then taxed at higher marginal rates through fiscal drag, retrieving a portion of the nominal gain that inflation had already eroded in real terms.
These four stages are not the complete circuit.
The fifth stage is the ratchet. Supply shocks, monetary expansions, and cost increases pass through to consumer prices rapidly and completely. The reverse does not occur. Firms are rationally incentivised to raise prices when costs rise and to maintain those prices when costs fall, because the equity market will punish margin compression and reward margin preservation regardless of the underlying cause. Critically, the media infrastructure surrounding every significant supply shock performs a secondary function invisible to competition law: it provides common knowledge – a Schelling focal point – that allows every firm in a sector to raise prices simultaneously, without coordination, using shared public expectations as both permission and cover. The inflation narrative, once established, does not expire when the supply shock does. The price increases it licensed remain.
The sixth stage is concentration. The competitive mechanism that would otherwise force price normalisation – a rival undercutting to gain share – has been systematically removed across sector after sector by a decades-long consolidation of market power. Firms with the patience and capital to sustain predatory pricing phases eliminate fragmented competition, achieve dominance, and then exercise the pricing power that dominance confers. Each inflation shock becomes not merely a cost pass-through event but a margin consolidation opportunity, protected by a market structure that renders the traditional self-correcting properties of competition largely inoperative.
The net position of the wage-earning household, measured from the beginning of this circuit to its end, is worse across every stage: poorer in real asset terms from Cantillon, poorer in nominal terms from fiscal drag, poorer in measured terms from CPI understatement, and poorer in purchasing terms from prices that rise with every shock and fall with none, in markets too concentrated to discipline themselves.
The net position of the asset-owning class, measured across the same circuit, is better at every stage.
Every link in this chain has a technical defence. Substitution reflects consumer behaviour. Hedonic adjustment captures genuine quality improvement. Geometric means mirror realistic purchasing patterns. Threshold freezes are not technically tax rises. Price stickiness is rational firm behaviour. Market concentration reflects efficiency gains from scale. Each individual argument has enough plausibility to occupy a committee, spawn a working paper, and delay a political response by a parliamentary cycle.
What none of these arguments explains is why every methodological choice, every policy design, and every market structure outcome points in the same direction – toward lower measured inflation, toward reduced apparent tax burden, toward prices that are easier to raise than to lower, in markets where the competitive pressure to do otherwise has been progressively eliminated.
The gilt market rendered its verdict long before this essay was written. The bond investors who demanded RPI rather than CPI were not making a theoretical argument about statistical methodology. They were expressing, in the most financially binding terms available, their assessment of the gap between the official account and the experienced reality. Governments paid the premium because they had no choice. The fact that they are now moving to eliminate that premium by legislative fiat – saving £2 billion per year at bondholders' expense, with no compensation – is not a reform of measurement. It is a demonstration of what measurement, in the hands of those who both produce and benefit from it, ultimately becomes.
Or more concisely:
"Show me the incentive, and I'll show you the outcome."
– Charlie Munger.
Sources
Un essai de
The Hermeutic
Hermeus
Hermeus · © 2026 The Hermeutic. Tous droits réservés.